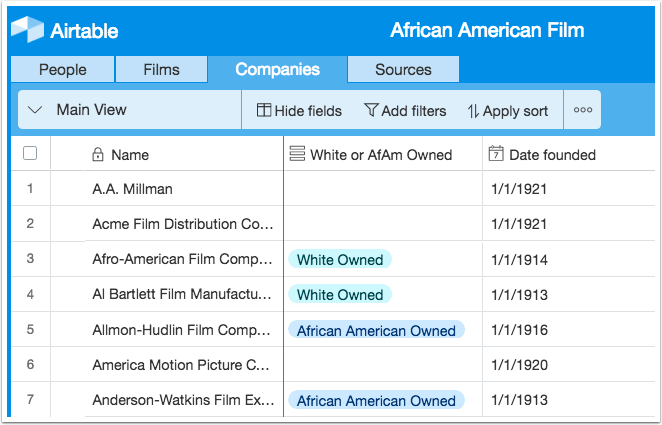
1. Switch to the Companies table
The Companies is the only one of our tables that contains location information. Switch to the Companies table by clicking on that tab.

The Companies is the only one of our tables that contains location information. Switch to the Companies table by clicking on that tab.
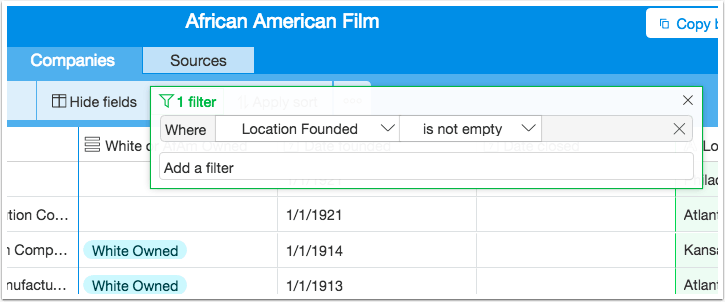
We don't have location information for every company (alas!), so let's filter this table so that it only shows companies for which we do have locations. This will make mapping easier later. Add a filter Where Location founded is not empty.
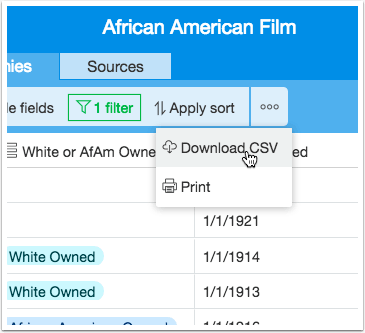
Now that we only have records that contain locations, we'll export those records from the database. Click on the button with three dots on it and then download the table as a CSV.
We're going to use the web-based mapping application CartoDB to map our data. CartoDB is often my first choice for web-based maps because it's very user-friendly, but also has some sophisticated features. You can easily share and embed CartoDB maps on websites. My students and I also like the way CartoDB maps look -- they're a little nicer-looking than Google maps, for example.
Sign up for a CartoDB account at https://cartodb.com/signup (after reading the terms and conditions, of course!).
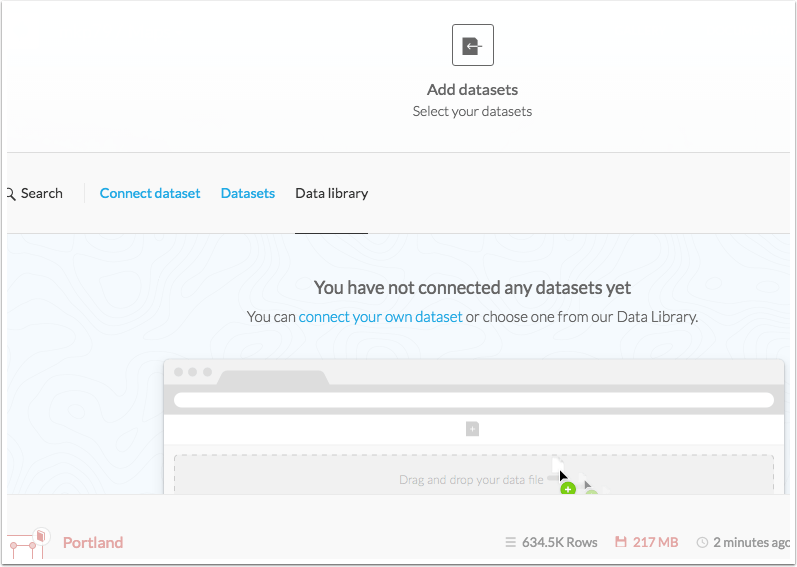
This is where you'll upload the data from which you'll build your maps. A note on terminology: CartoDB uses the phrase Connect dataset rather than Upload dataset because you *do *have the option of connecting CartoDB to a table that changes -- a Google spreadsheet that you continuously update, for example. That way your map will always be up to date.
We're just going to upload a spreadsheet today, but it's nice to know about this other option.
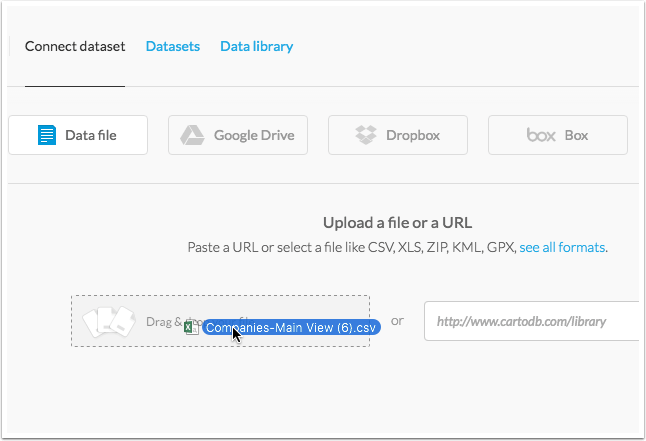
After clicking on the Connect dataset tab, drag the file you downloaded in Step 3 onto the field that says Drag & drop your file.
Then, click on Connect Dataset (the big green button at the bottom of your screen).
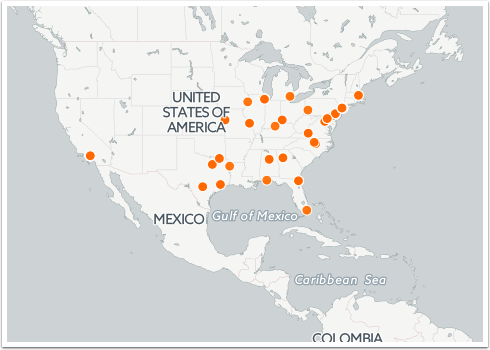
You might have to drag the map a bit so that it centers on the United States. CartoDB mapped your points automatically because the table you downloaded from our database contained geocoordinates (latitude and longitude coordinates), which CartoDB was smart enough to recognize.
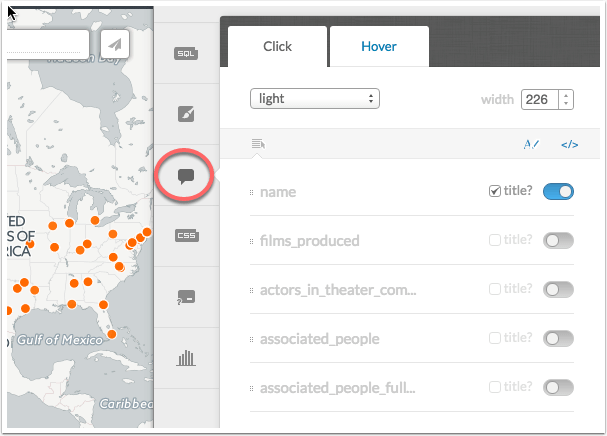
Infowindows is the name CartoDB gives to the little pop-up windows you expect to see when you click on a point. From the toolbar on the righthand side of the window, click on the icon that looks like a speech bubble.
Then, switch the toggles to the "on" position for all the fields you want to see in your infowindow.
You can also drag the fields to change the position in which they appear in the infowindows.
Now try clicking on your map's points again. You should now see infowindows.
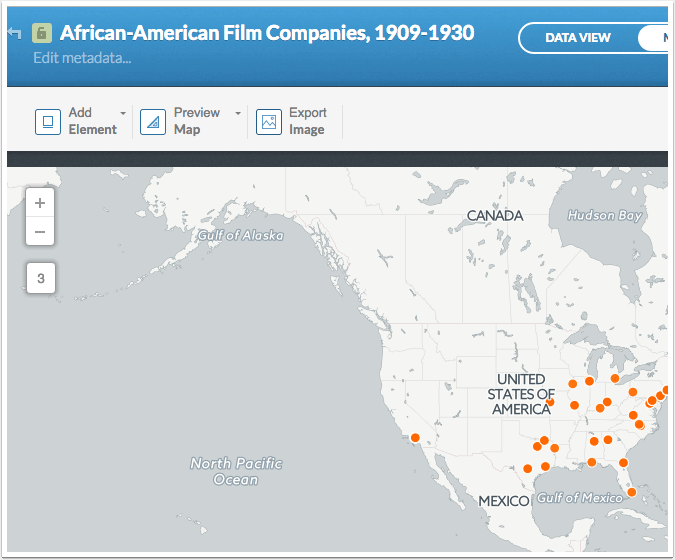
Click on the title of your map to give it a title of your own.
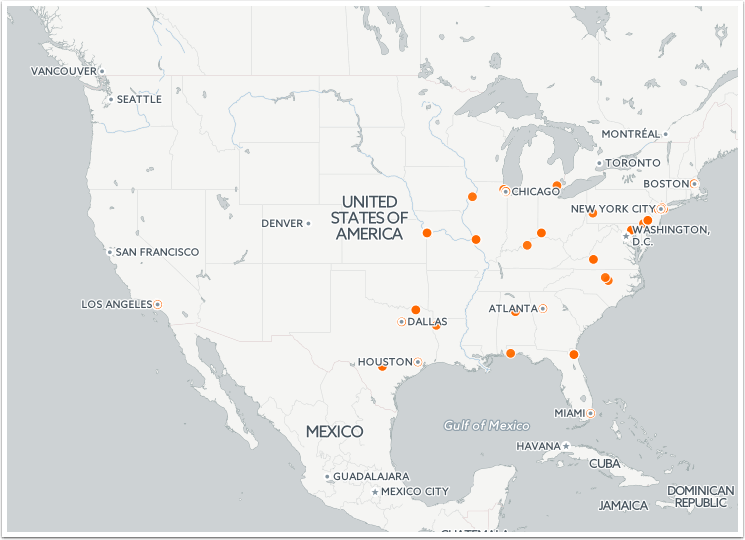
Click on the Publish button on the top right of the window. You can, at this point, either copy the link to the standalone map or copy a snippet of code that will allow you to embed your map on a webpage (like a WordPress blog).
Copy the standalone link now and admire your map. You can now share your map with others!